It’s quite common for organizations to have complex reporting requirements that combine multiple data sources. In these cases, an efficient way to get at Google Analytics data is to use the API. But for those without the development resources needed to access the API there are many Google Analytics Apps available that can offer a solution. The following mini case study is about Analytics Canvas, a 3rd party Google Analytics App. Analytics Canvas helped Fairmont Raffles Hotels International take a complex reporting task and make it easy.
Like most global organizations, Fairmont Raffles Hotels International has regionally operated business units. Each unit typically maintains its own reporting profile in Google Analytics. But with individual business unit profiles, how do you analyze the data across all the business units? And, how do you combine external business data with each of these Google Analytics profiles?
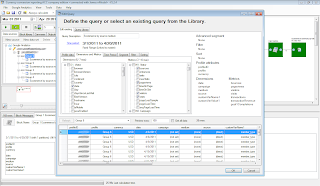
For Fairmont Raffles Hotels International, the answers lie in the Analytics Canvas tool from nModal. Analytics Canvas is an easy to use, drag-n-drop interface for creating data queries and transformations needed for advanced reports and dashboards. Analytics Canvas can extract data from multiple Google Analytics accounts, combine it with additional data sources, and then segment and filter the data.


Barbara Pezzi, Director Analytics & Search Optimization, Fairmont Raffles Hotels International, uses Analytics Canvas to automate her complex reporting tasks. “We trade in over 10 different currencies on our websites. We needed to have multiple international hotels’ eCommerce data converted to a common currency in various reports, such as ‘All Traffic Sources’ and ‘Campaigns’, to analyze the overall production of each traffic channel and marketing initiative. Traditionally we would have to export data from multiple profiles and do currency conversion by hand in spreadsheets. With almost 100 hotels, the large number of profiles made it a very time consuming and potentially error prone task to get a multi-hotel, single currency report.” With Analytics Canvas, Fairmont automated this task in minutes with a single currency report for all its hotels.

Analytics Canvas was built by nModal Solutions Inc using the Google Analytics API. Here is what James Standen, the founder of nModal, has to say “The Google Analytics API is very easy to use and the full access to data makes it possible to make a very powerful query interface. So far we’ve had a great response to Analytics Canvas. People are very pleased to have greater access to their web traffic data, and we’re thrilled to hear about the interesting new applications and integrations our customers are able to do using our tool.”
The Analytics Canvas application can be found through the Google Analytics App Gallery and can be downloaded from the Analytics Canvas website.
If you’re interested in developing applications for the Google Analytics platform visit Google Analytics for Developers.


0 comments:
Post a Comment