New AdSense Data in the Core Reporting API

Google AdSense is a free, simple way for website publishers to earn money by displaying targeted Google ads on their websites. Today, we’ve added the ability to access AdSense data from the Google Analytics Core Reporting API. The AdSense and Analytics integration allows publishers to gain richer data and insights, leading to better optimized ad space and a higher return on investment.

In the past, accessing AdSense data using the Analytics Core Reporting API has been a top feature request. We’ve now added 8 new AdSense metrics to the Analytics Core Reporting API, enabling publishers to streamline their analysis.

Answering Business Questions
You can now answer the following business questions using these API queries:

Which pages on your site contribute most to your AdSense revenue?


dimensions=ga:pagePath
&metrics=ga:adsenseCTR,ga:adsenseRevenue,ga:adsenseECPM &sort=-ga:adsenseRevenue

Which pages generate a high number of pageviews but aren't monetizing as well as other pages?
dimensions=ga:pagePath
&metrics=ga:pageviews,ga:adsenseCTR
&sort=-ga:pageviews

Which traffic sources contribute to your revenue?
dimensions=ga:sourceMedium
&metrics=ga:adsenseCTR,ga:adsenseRevenue,ga:adsenseECPM
&sort=-ga:adsenseRevenue

Reporting Automation
By accessing this data through the API, you can now automate reporting and spend more time doing analysis. You can also use the API to integrate data from multiple sites into a single dashboard, build corporate dashboards to share across the team, and use the API to integrate data into CRM tools that display AdSense Ads.

Getting Started
To learn more about the new AdSense data, take a look at our Google Analytics Dimensions and Metrics Explorer. You can also test the API with your data by building queries in the Google Analytics Query Explorer.

Busy? In that case, now’s a great time to try these Analytics API productivity tools:
  • Magic Script: A Google Spreadsheets script to automate importing Analytics data into Spreadsheets, allowing for easy data manipulation. No coding required!
  • Google Analytics superProxy: An App Engine application that reduces all the complexity of authorization.

We hope this new data will be useful, and we're looking forward to seeing what new reports developers build.

Posted by Nick Mihailovksi, Product Manager, Google Analytics API Team

An Easy Way to Upgrade to Universal Analytics

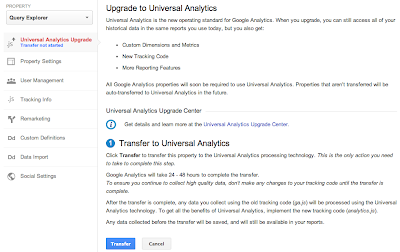
Last year we launched Universal Analytics, a new technology that allows you to measure customer interactions across platforms and devices. As we announced at the 2013 Google Analytics Summit, we’ve been working on a solution to help you upgrade your existing properties to the new infrastructure without losing any historical data.

Today, we’re announcing the Universal Analytics Upgrade Center, an easy, two-step process to upgrade your existing properties from classic Google Analytics to Universal Analytics.

Once you complete the upgrade process, you can continue to access all of your historical data, plus get all the benefits of Universal Analytics including custom dimensions and metrics, a simplified version of the tracking code, and better cross-domain and cross-device tracking support.

Getting Started

You can upgrade your classic Google Analytics properties into Universal Analytics properties by following these two steps:

Step 1: Transfer your property from Classic to Universal Analytics.
We’ve developed a new tool to transfer your properties to Universal Analytics that we will be slowly enabling in the admin section of all accounts. In the coming weeks, look for it in your property settings.


Step 2: Re-tag with a version of the Universal Analytics tracking code.
After completing Step 1, you’ll be able to upgrade your tracking code, too. Use the analytics.js JavaScript library on your websites, and Android or iOS SDK v2.x or higher for your mobile apps.

Universal Analytics Auto-Transfer

Our goal is to enable Universal Analytics for all Google Analytics properties. Soon all Google Analytics updates and new features will be built on top of the Universal Analytics infrastructure. To make sure all properties upgrade, Classic Analytics properties that don’t initiate a transfer will be auto-transferred to Universal Analytics in the coming months.

Upgrade Resources

To answer common questions, we’ve put together the Universal Analytics Upgrade Center, a comprehensive guide to the entire upgrade plan. This guide includes an overview of the process, technical references for developers, and a project timeline with phases of the overall upgrade.

We’ve also included FAQs in the Upgrade Center, but if you need more information, you can also visit the new Universal Analytics Google Group to search for answers and ask more specific questions.

We’re excited to offer you this opportunity to upgrade, and hope you take advantage of the resources we’ve created to guide you through the process. Visit the Universal Analytics Upgrade Google Group to share your comments and feedback. We’d love to hear what you have to say!

Posted By Nick Mihailovski, on behalf of the Google Analytics Team

New Sample Size Control and Relative Dates Features in Google Analytics APIs

Our goal is for Google Analytics APIs to be as simple to use as possible - so we just released 2 new features that make it even easier to use our APIs.

Relative dates
All Core API and MCF Reporting API queries previously required a start and end date. In the past, apps that displayed recent data - like the last 14 days - would have to manually determine today’s date, determine when 14 days ago was, and format the dates so they could be used.

To make things easier, we’ve added support for relative dates! You can now specify NdaysAgo as a value of either the start or end date. So the date range of the last 14 days from yesterday can now be expressed as:

start-date=15daysAgo&end-date=yesterday

Using these values will automatically determine the date range based on today’s date, allowing apps to always display the data for last 14 days (or whatever time period you’d like!).

Sample size control
In certain cases, data may be sampled. To simplify setting and reporting the impact of sampling, we’ve added a couple new sampling related features.

First, we added a new query parameter to set the level of sampling. Developers can now specify whether reports should be faster or be more precise.

Second, we added 2 new fields to the API response:

  • sampleSize - The number of samples that were used for the sampled query.
  • sampleSpace - The total sampling space size. This indicates the total available sample space size from which the samples were selected.
     

With these 2 values you can calculate the percentage of visits that were used for the query.

For example, if the sampleSize = 201,000 and sampleSpace = 220,000 then the report is based on 91.36% of visits.


Together, these values allow developers to see exactly how much data was used to calculate the sample.

Getting Started
There are two easy ways to get started: you can read our reference guide on the new relative dates feature, or check out our docs on the new sample size control query parameter and
sample size API response data. As always, you can stay up to date using our change logs
.

New Google Analytics APIs for Large Companies

Many large companies have unique needs, with dozens of websites and many users. In the past, configuring Google Analytics for these companies was time-consuming and required too many clicks.

We're thrilled to announce a new set of APIs that will make it even easier for large companies to manage multiple websites. These APIs will streamline the Google Analytics setup process, allowing IT teams to programmatically manage and configure Google Analytics, so teams can focus their efforts on analysis and gaining insights.

Account Setup and Configuration APIs
To simplify account setup, we’ve added new APIs to manage Properties, Profiles, and Goals. This reduces the time it takes to build new account structures, and allows you to enable new features across all your existing accounts.


Note: These APIs are currently available in closed beta. Please sign up here to request access.

User Permissions APIs
To reduce the overhead in managing user access, we’ve also added APIs to manage user permissions across all your accounts. With these APIs, you can quickly list which users have access to your accounts. You can also now write programs to sync Google Analytics users with corporate directory services such as LDAP.


The User Permissions APIs are public and can be used today.

Getting Started
To get started, you can find all the API resources on our Google Analytics APIs for Large Companies page. This launch brings new opportunities to developers, IT Teams, and Google Analytics users. Let us know what you think!

Google Analytics on Google Developers Live

Ever wanted to learn more about Google Analytics APIs? Maybe even have someone talking to you about how to use them? Well, if you haven’t gotten a chance to tune in, we’re excited to present Google Analytics on Google Developers Live. Our Developer Relations team has been hard at work putting these together; we’ve done a few already, and also have some coming up that we’re excited about!

We'll be doing these a few times a month, on Thursdays at 10AM PDT (full schedule here). Each show is about a half hour.


The show will either take you “Behind the Code” or “Off the Charts.” Off the Charts is a series about getting into the deep features of Google Analytics, understanding how it works, things you can do with it and how to use the feature itself. “Behind the Code” will not only showcase new GA features and technology, but also take us behind the scenes and give you a chance to hear directly from some of the engineers, product managers, and others who work behind the scenes to design, build, and deliver these new features.


Here’s some of our favorites from the past:

Off the Charts: Google Analytics superProxy


Google Analytics superProxy is an open source project developed by the Google Analytics Developer Relations team. Join Developer Advocate Pete Frisella to learn how to use this application to publicly share your Google Analytics reporting data and power your own custom dashboards and widgets.

Behind the Code: Analytics Mobile SDK


The new Google Analytics Mobile SDK empowers Android and iOS developers to effectively collect user engagement data from their applications to measure active user counts, user geography, new feature adoption and many other useful metrics. Join Analytics Developer Program Engineer Andrew Wales and Analytics Software Engineer Jim Cotugno for an unprecedented look behind the code at the goals, design, and architecture of the new SDK to learn more about what it takes to build world-class technology.


Don’t forget to check out next week’s show (8/29, 10AM PDT) on the recently launched Metadata API, which contains all the dimensions and metrics that you can query with in Google Analytics Reporting APIs. We’ll be discussing how you can use this API to to simplify data discovery. Tune in here!


Posted by Aditi Rajaram, Google Analytics Developer Relations team

Introducing The New Google Analytics Metadata API

Google Analytics users can use the Core Reporting API to save time by building dashboards and automating complex reporting tasks. This API exposes over 250 data points (dimensions and metrics), and new data is added every few months. For many developers, it can be difficult to keep their applications up to date with all the latest data.

To make things easier, today we are launching the new Google Analytics Metadata API to simplify data discovery. The Metadata API contains all the queryable dimensions and metrics included in the Core Reporting API. We’ve also added attributes for each dimension and metric, such as the web or app name, full text description, grouping, metric calculations, deprecation status, and whether the data is queryable in segments. You can check out at a live Metadata API response here.

You now have programmatic access to generate the same list of dimensions and metrics we use to generate our public documentation.


You can now create this list using the Metadata API.

Saving Developers Time

When you create tools to query the Core Reporting API, you can use the Metadata API to automatically update your user interfaces. For example, Analytics Canvas, a popular 3rd party Google Analytics data extraction tool, uses the Metadata API to keep its query building interface up to date.


Analytics Canvas uses the Metadata API to power its query builder.

According to James Standen, founder of Analytics Canvas, "In the past, keeping Analytics Canvas up to date with the Google Analytics API dimensions and metrics required a lot of manual updating to our application. The new Metadata API automates this process, saving us time, and giving our users direct access to all the great new data the instant it's available. Users love it!"

New Deprecation Policy

To increase data transparency, we’ve also published a new data deprecation policy for dimensions and metrics. New data we release will be announced on our changelogs and automatically added to the Metadata API. Data we decide to remove will be marked as deprecated in the Metadata API, allowing developers to gracefully remove these values from their tools.

Get Started Today

Our goal was to make this API super easy to use. To get started, take a look at our list of resources below:

Questions? Comments? Simply want to share in the excitement? Join the analytics developer community in our Reporting API Developer forum.


Posted by Nick Mihailovski & Srinivasan Kannan, Google Analytics API team

Google Analytics Launches Real Time API In Beta

When we first launched Real Time Analytics 2.5 years ago we set out to enable marketers to take real-time action against their data. Manually taking action and being informed about the immediate performance of your site is fantastic, however it’s not realistic to sit at your computer 24/7 and take advantage of these insights. Also and perhaps more importantly, your reflexes can never be as fast as computers. So the next logical step has always been to programmatically take action using real-time analytics. Towards that end, we’re pleased to announce an invitation to join the beta for the Real Time Reporting API!
This means you can now make queries about your real-time data and use that information in whatever way you please. One of the immediate use cases is to manage the content on your webpage. For example, you can query the API for the top visited URLs to construct a top trending content widget with the number of active readers. A site can also use what I call the “web counter 2.0”, meaning to display the active visitor count in real-time. Seeing the number of visitors also viewing a piece of content has a number of subtle effects such as creating a sense of community and credibility. 

Additionally this metric can be shown on different conversion pages of a website to impart a sense of urgency and demonstrate demand for a given product. Twiddy, a family-owned vacation rental company, with the help of their consultant Joe Akinc, has been testing this and achieving great results. Not only did their revenue increase 18.6%, but the average order value increased 11.9% and the conversion rate increased 7.9%. See the Twiddy case study for the full story and the screenshot below for an example of how this looks visually on their search results page:


“Before Google Analytics, our site was based on the two principles of marketing: booze and guessing, It worked for Don Draper, but we weren’t that smooth. We could never figure out what was working or failing. GA was easy to install and easy to understand. Our learning curve accelerated immediately. We quickly started re-allocating resources to improve our guest experience. ” --Ross Twiddy

Other uses also include a custom executive dashboard to monitor key metrics for your business. Or check out this android app that our very own Clancy Childs built to display the number of active visitors on a pebble watch:


For developers the GA superProxy will also work well with the real-time API and Google Charts API (gviz). This enables you to publish a query that is available without authentication. This has advantages in that you can make the request client side so a widget can be written in javascript and added to a site (calling all 3rd party developers!). Additionally this acts as a cache effectively lifting your quota limits. Learn more about GA superProxy here.

We are releasing the real-time reporting API in a closed beta and there will not be an SLA enforced against the data. As such please be cognisant of this when creating anything that will be customer facing. And as always we are extremely excited to see all the creative ways that the data will be used. 

Sign up for the beta here and please feel free to send us your feedback and use cases. We will be whitelisting customers in the next couple weeks which will include further details including quota. Also be sure to check out our developer docs.

Happy Real Timing!
Posted by Linus Chou, Kasem Marifet & Ozan Hafizogullari on behalf of the Real Time Team

40 New Data Points In Google Analytics API

Over the past year we’ve added many new features to Google Analytics. Today we are releasing all of this data in the Core Reporting API!


Custom Dimensions and Metrics

We're most excited about the ability to query for custom dimensions and metrics using the API.

Developers can use custom dimensions to send unique IDs into Google Analytics, and then use the core reporting API to retrieve these IDs along with other Google Analytics data.

For example, your content management system can pass a content ID as a custom dimension using the Google Analytics tracking code. Developers can then use the API to get a list of the most popular content by ID and display the list of most popular content on their website.

Mobile Dimensions and Metrics

We've added more mobile dimensions and metrics, including those found in the Mobile App Analytics reports:

  • ga:appId
  • ga:appVersion
  • ga:appName
  • ga:appInstallerId
  • ga:landingScreenName
  • ga:screenDepth
  • ga:screenName
  • ga:exitScreenName
  • ga:timeOnScreen
  • ga:avgScreenviewDuration
  • ga:deviceCategory
  • ga:isTablet
  • ga:mobileDeviceMarketingName
  • ga:exceptionDescription
  • ga:exceptionsPerScreenview
  • ga:fatalExceptionsPerScreenview

Some examples of questions this new data can answer are:

Local Currency Metrics

If you are sending Google Analytics multiple currencies, you now have the ability to access the local currency of the transactions with this new data:

  • ga:currencyCode
  • ga:localItemRevenue
  • ga:localTransactionRevenue
  • ga:localTransactionShipping
  • ga:localTransactionTax

Time Dimensions

We also added new time based dimensions to simplify working with reporting data:

  • ga:dayOfWeekName
  • ga:dateHour
  • ga:isoWeek
  • ga:yearMonth
  • ga:yearWeek

Sample queries:

Traffic Source Dimensions

Finally, we've added two new traffic source dimensions, including one to return the full URL of the referral.

  • ga:fullReferrer
  • ga:sourceMedium

Sample query: the top 10 referrers based on visits (using full referrer).

For a complete list of the new data, take a look at the Core Reporting API changelog.
For all the data definitions, check the Core Reporting API Dimensions and Metrics explorer.
As always, you can check out this new data directly within our Query Explorer tool.
We’re very excited to release this data and thrilled to see what developers build next!

Posted by Srinivasan Kannan & Pete Frisella, Google Analytics API Team

Google Analytics Becomes A Robust Testing Platform With Content Experiments API

Our Analytics API enables marketers and developers to experiment and build new tools powered by Google Analytics. Over the past year, we’ve listened to your feedback and made improvements to the API such as expanding data points available and integrating with Apps Script. Our goal is to provide the most flexible and useful Analytics API on the web enabling you to do everything from build great apps to automate / expedite busywork. 

Today, we’re excited to share the launch of an API for Content Experiments — our tool for easily testing site content with programmatic optimization to achieve Analytics objectives. This API makes Google Analytics a full-blown A/B testing platform where developers of all types can leverage the power of Google Analytics to run their experiments. By utilizing our multi-armed bandit approach, you can maximize results by efficiently determining which assets on your site perform best to offer an improved experience for users. Multi-armed bandit experiments are powerful and efficient tools and with the new Content Experiments API, you can get even more from them.

The Content Experiments API allows you to pick and choose from all the testing functionality Google Analytics has to offer and to combine it into powerful solutions that best fit your particular needs:

Testing changes to content without redirects. 
The original Content Experiments JavaScript snippet made testing a breeze. To keep things simple and consistent for all publishers, the snippet causes a page redirect which may take away from the end user experience in certain cases. Now, with the new Content Experiments API, testing changes to content without redirects is both possible and easy to implement.

Testing items server-side such as the result set of a database query.
Major testing platforms typically offer changes on the client-side but not server side. With Content Experiments API you can now run tests on the server side and try things like implementing different recommendation or search algorithms to determine what works best for your site.

Testing with your own variation selection logic and use Google Analytics for reporting.
While the multi-armed bandit approach to experimentation is one of Content Experiments most powerful features, there are times where publishers and developers would prefer to decide for themselves how to serve variations - be it evenly or using proprietary logic. The Content Experiments API makes it possible for you to bypass our programmatic optimization while allowing you to continue to enjoy the powerful experiment reporting Google Analytics provides.  

Testing in non-web environments using measurement protocol.
For example, if you have a kiosk in your physical location (such as airline terminal or retail store) you can test different layout variations of content and features and determine what users can complete quickest or at highest value.

Developers are already putting the Content Experiments API to work and we’ve been hearing great feedback. Paras Chopra, Founder & CEO of  Visual Website Optimizer reports:

"We're thrilled about the possibilities opening up with the new Content Experiments API. This new API is specially designed to infuse the powers of Google Analytics into testing and experimentation domain. We're very proud to be one of the beta-testers with Google and soon we will start rolling out the integration of Visual Website Optimizer with Google Content Experiments across our joint customer base. When Google releases an API, it's a big move for the A/B testing industry and we're excited to be their launch partners."

Learn how to get started with our Content Experiments API on our developer site or if you’re still new to the platform, get an overview of Content Experiments in our help center.

Happy testing & experimentation! 

Posted by Russell Ketchum, Google Analytics Team

Get Useful Insights Easier: Automate Cohort Analysis with Analytics & Tableau

The following is a guest post by Shiraz Asif, Analytics Solutions Architect at E-Nor, a Google Analytics Certified Partner.

Cohort analysis provides marketers with visibility into the behavior of a “class” of visitors, typically segmented by an action on a specific date range. There are many applications and businesses that would benefit tremendously from cohort analysis, including the following sample use cases:
  • What traffic channel yields the most valuable customers (not just valuable one time conversions)
  • Customer life time volume based on their first bought item (or category)
  • Methods for gaining and retaining customers and which groups of customers to focus on
  • For content and media sites, understanding frequency, repeat visitors and content consumption after sign up or other key events
  • Repeat Purchase Probability 
If you read E-Nor President and Principal consultant Feras Alhlou’s latest post on cohort analysis in a cross-platform environment, and read until the very end, you saw a note about a follow up post on how to automate cohort reporting from Google Analytics in Tableau. This is what I'll outline in today’s post. Why the emphasis on automation, you might ask? Without automation, we end up spending more time than necessary on exporting/copying/pasting/massaging data which can eat up resources better used analyzing and optimizing. 

In addition to report automation, data visualization is also key. Google Analytics offers amazing visualization, including the recently announced dashboard enhancements, but at times you also want to view the data and trend it or merge with other sources. For this, its best to use tools available in the Google Analytics Application Gallery or a BI platform like Tableau.

With the introduction out of the way, following is a step-by-step guide to automated, cohort analysis with Google Analytics and Tableau:

1. Cohort Data Elements in Google Analytics

If you have your cohort data elements already captured in Google Analytics, then skip this step, otherwise, this post is on setting up cohort data in by Google’s Analytics Advocate Justin Cutroni is a must.

2. Tableau version 8 (Google Analytics connectors)

In order to automate reports, you need to have Tableau version 8, since this is the version that has a Google Analytics connector (works well, although still in beta).

3. Data Import from Google Analytics Into Tableau
  • From the Tableau home screen, select Connect to Data, and then pick the Google Analytics connector. After authenticating to Google Analytics, you'll be prompted to select your Account, Property and Profile, if you have access to more than one.
  • Set up the data import to get your Custom Variable key (e.g. CV1) and Date as dimensions, and Revenue as a Metric.

4. Tableau Cohort Analysis Configuration
  • Change the format from Google's 20130113 to a Tableau DATE format. Since the date was stored in a custom variable, it was stored as a string. So that Tableau can treat this as a date, we need to convert the string to a date format. This was done by creating a new Calculated field in Tableau. We called the field "Cohort Date". The formula below worked for our purposes but would require some tweaking for larger datasets.
  • Now that we have the date in the format we want, the next step is to subtract the cohort date from the transaction date.  To do this, we created another calculated field called "Days since Signup". The formula for this field was simply:
DATEDIFF('day',[Cohort Date],[Date]). 

Important:  Tableau natively treated this as a "Measure" since it is a number. However since we're going to be graphing this on the X Axis, you should drag it to the Dimensions pane.
  • Drag the Revenue measure to the rows Rows tab. Now drag the Days since Signup to the Columns tab. You should see a long graph similar to:
  • Drag the Cohort date to the Filter pane, and select the cohort dates you'd like to visualize. For ease of use, I suggest, select only a few to begin with. Drag the Cohort to the color shelf to enable color coding of individual cohort dates.
  • Now let's make a couple of adjustments to make the visualization more useful. In the color shelf, click the down arrow next to Cohort Date, and change the default display from Continuous to Discrete. Then, in the same field, select Exact Date instead of Year.
Voila! Your final view should look like this: 

There you have it. With a few steps, we’ve pulled data from Google Analytics via the API using Tableau, massaged the data and then created a very insightful visualization. With this work now done, the graphic can be easily updated/refreshed. This takes the manual and mundane work of setting up the graphic and automates it so we can spend more time analyzing the data and finding hidden insights for our clients.  

Posted by Shiraz Asif, Analytics Solutions Architect at  E-Nor, Google Analytics Certified Partner. Learn more about E-Nor on their website, Google+ or check out their Marketing Optimization blog.