Using a permanent URL to share Custom Attribution Models & Custom Channel Groupings

The need to customize and fine-tune your marketing measurement solutions becomes a key discriminator in unlocking additional value which might have been missed when applying out-of-the-box views on your data. For this reason, the Multi-Channel Funnel Analysis within Google Analytics Attribution provides the ability to configure content based channel groupings, as well as customized attribution models. This allows you to better reflect how partial credit is assigned to the marketing efforts driving your conversions. Having the ability to develop these customized assets is great, and now you are able to easily share them with your organization, your customers, or your audience. Here is how sharing a custom channel grouping, or custom attribution model works: 

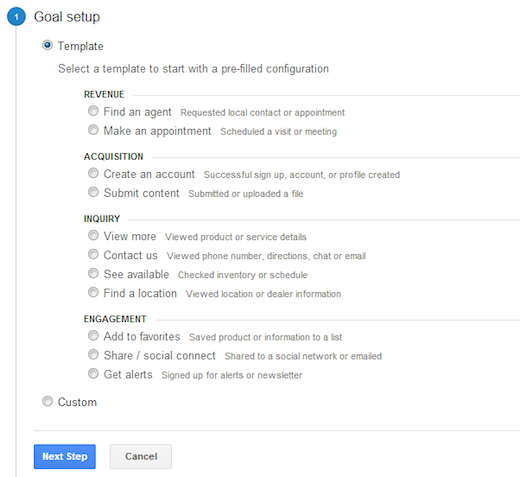
Step 1 - Build a Custom Attribution Model
Building a custom model is easy. Just go to the Model Comparison Tool report in the Attribution Section of Conversions. In the model picker you can select ‘Create new custom model’, which opens the dialog to specify rules which can better reflect the value of marketing serving your specific business model. As an example, we can develop a model to value impressions preceding a site visit higher within a 24 hour time window. We also set the relevant lookback window to 60 days, as we know our most valuable users have longer decision and decide cycles:

Click image for full-sized version
Ensure you opt-in the Impression Integration, enabling Google Display Network Impressions and Rich-Media interactions to be automatically added to your path data through the AdWords linking. Don’t forget to also check out the recorded webinar from Bill Kee, Product Management Lead for Attribution, providing more details on how to create a custom model.

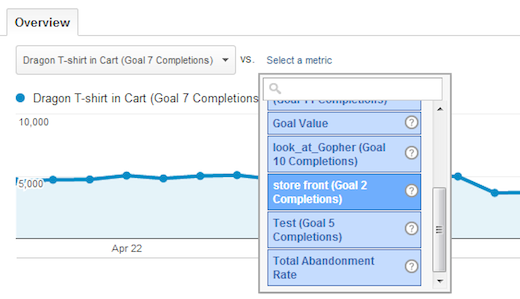
Step 2 - Access the Model in Personal Tools & Assets Section
In the admin section you can now look at your personal tools & assets. The newly created model will show up in the ‘Attribution Models’ section. You can find custom channel groupings you created under Channel Groupings.


The table shows all assets available, and a drop-down allows you to ‘share’ these assets through a link.


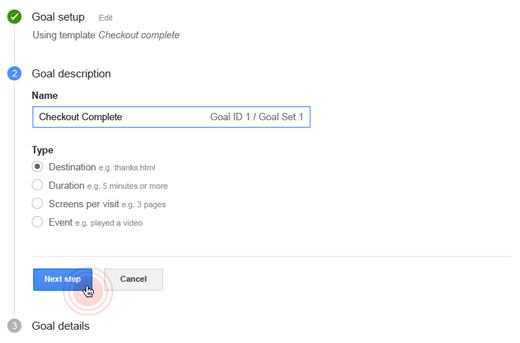
Step 3 - Share the Link - Done!
From the drop-down Actions menu select ‘Share’, and a permanent link to the configuration of this object is generated. This link will point to the configuration of the shared asset, allowing anyone with a GA implementation and the link to make a copy of the asset config, and save it into their instance of GA. You maintain complete control over who you share your assets with. 


Include the link to your brand-new attribution model asset in an email, IM message, or even a Blog Post, such as this one.

Happy Customizing!

Posted by Stefan F. Schnabl, Product Manager, Google Analytics

Webinar Video: Combined Power of AdWords and Analytics

Last Tuesday, Rachel Witalec and Simon Rosen, Global Sales Strategy Leads, shared tips for getting more out of your Google Analytics and AdWords accounts by using them together. During the webinar, they showed why it’s important to link your Google Analytics and AdWords accounts (which is now even easier to do) and how to see Google Analytics data in AdWords as well as AdWords data in Google Analytics. They also presented a live demo of the reports and how to use them.

If you missed the webinar, you can check it out here:


Read on below for answers to some of the top questions we received during the webinar:

Why should I link my AdWords and Google Analytics accounts?
Linking your AdWords and Google Analytics accounts is an important practice to ensure the two measurement tools can work together to help you get the most from your advertising. The bottom line is that linking Analytics and AdWords gives you powerful information that can tell you where you should be spending more or less based on real ROI data. When you link accounts, the data can flow both ways - from Google Analytics to AdWords (for example, engagement metrics or remarketing lists), and from AdWords to Google Analytics (for example your AdWords cost data). In particular, you can take advantage of powerful features such as:
We covered this topic in detail during the webinar, so watch the video above to learn more.
    Could you share the list of resources that were provided during the webinar?
    Of course! Here are the links and resources we shared:
    What are the best practices around importing Google Analytics Goals? If i’m using AdWords Conversion Tracking should I also import goals?
    If you’re currently using AdWords Conversion Tracking, there are still benefits to also importing some of your goals from Google Analytics. In particular, some goals (such as engagement goals) can’t be tracked with AdWords Conversion Tracking, so importing these into AdWords can complement your Conversion Tracking data. However, it’s important not to import any goals that you are already tracking through AdWords Conversion Tracking as this can create double-counting and duplication, which would make your conversion data hard to interpret.

    Is it possible to link a My Client Center (MCC) account to Google Analytics?
    At this time it’s not possible to link an MCC to Google Analytics. Each individual AdWords account within an MCC needs to be linked to the appropriate Google Analytics property. Learn more here.

    How do I import Google Analytics engagement metrics into AdWords?
    The process for importing the metrics is straightforward, but it’s important to note that there are a couple of additional steps needed beyond linking the AdWords and Analytics account. The full set of instructions can be found here.

    I have noticed discrepancies between the data in my AdWords and Google Analytics accounts, do you know why?
    AdWords and Google Analytics differ in some very important ways regarding how they measure and report on data. It’s important to understand these key differences, which are outlined here. Additionally, there are key differences between AdWords Conversion Tracking and Google Analytics, which are covered in detail here.

    Can someone help me get more support with AdWords and Google Analytics?
    Yes, Google partners with a global network of certified partners to help. For AdWords, you can get support directly from Google or you can work with a Google Certified Partner to help with your AdWords management. You can learn more about both of those options here. If you’re looking for help with Google Analytics, you can tap into our global network of Google Analytics Certified Partners, who offer paid services for anything from Google Analytics tag implementation to product training to more strategic support. Learn more here.

    What is a tag?
    Tags are tiny bits of website code that let you measure traffic and visitor behavior, understand the impact of online advertising and social channels, use remarketing and audience-based marketing, test and improve your site, and more. The tags we mentioned in the webinar are AdWords Conversion Tracking and Google Analytics. These both help you understand the performance of your digital campaigns. While AdWords tracks the performance of your Google AdWords campaigns, Google Analytics tracks the performance of any traffic to your website -- such as from email marketing campaigns or social media. You can learn more about how they’re different here and through some of the content in the webinar.

    What is a conversion?
    A conversion is an action that a customer takes on your website that has value to your business, such as a purchase, a sign-up, or a view of a key page. These actions are called conversions because a customer's click translated -- or converted -- to business. Think of it as the cha-ching! from your cash register. A conversion happens when someone clicks your ad and then does something that’s valuable to your business, such as an online purchase or a call to your business from a mobile phone. Conversions help you understand how much value your ads bring to your business. You can read more here

    Evaluate Marketing Spend Efficiency with our Conversion and Attribution Tools

    You invest a lot to create your marketing campaigns, and it’s important to see how your spend impacts results. In addition to comparing the conversion performance of your marketing activities, you can now view your imported AdWords cost data directly in the Google Analytics Attribution Model Comparison Tool. By evaluating your AdWords cost data under various lenses offered through Attribution, you’ll get further insight into the effectiveness of your marketing spend. We will gradually roll out this feature out to all of Google Analytics.

    Extended Set of conversion data
    As previously announced, to make the analysis of your conversion path data even more meaningful, we extended the lookback window within Multi-Channel Funnels to 90 days. This functionality is now available through the standard lookback window selector. Please see our help center for more details.

    Explore different attribution models to see revised performance figures
    Cost Per Acquisition (CPA) is one of the strongest indicators for marketers. Our Model Comparison Tool now makes this important metric available to advertisers in Google Analytics. In addition to CPA, we also allow users to look at the Return On Ad Spend (ROAS) figure, which compares the value or revenue driven by conversions under different attribution models.

    As described in the Customer Journey to Online Purchase, marketing channels influence the customer at multiple touchpoints on the path to conversion. Display touchpoints, in aggregate, appear 3.1 times more often in the upper funnel (awareness, consideration, intent phase) than in the lower part of the funnel (decision phase).*


    Selecting Conversion Value & ROAS from the selector in the Attribution Model Comparison Tool allows you to contrast the value driven by your spend. Comparing the performance of a channel by looking at two different attribution models can uncover hidden performance of this channel. In the above example, the Display channel drives 20% more value under a First Interaction model.

    Interpret your analysis
    The direction of the arrow in the % change column indicates the orientation of the shift. Please note that it matters which model is the reference model, and which model is the comparison model. A positive shift away from the valuation of the reference model will be visualized with an upwards arrow, a negative shift with a downwards arrow. The color of the arrows is used to indicate whether the alternative valuation of the comparison model has caused a favorable shift. Green indicates a significant shift in favor of the comparison model, and red indicates a significant shift in favor of the reference model. A gray dot symbol indicates that there is no relevant change between the reference and comparison model.


    Get started today by linking your account to an AdWords cost data source. The more complete your cost data is for a given profile, the more stable and accurate are the insights you can gain from the analysis. Consider using the Cost Data Import service provided through the GA API to add cost data beyond AdWords.

    *Source: Google Analytics, Q4 2012. N = US: 130M conversions (12K profiles)

    See the full Impact of Unclicked Display and Video Ad Impressions using Google Analytics

    Every customer journey is different — a customer may see your display or video ads, receive an email, and then click through to your site from a search ad or organic search listing. Often, viewing display ads can attract your clients’ interest in your product and brand even if no click occurs. Traditionally, measurement technology separated out impressions or “view throughs” from clicks, but this separation missed out on valuable data on the impact of display advertising.

    Thanks to our integration with the Google Display Network (GDN), Google Analytics can now break down the separation between clicks and impressions and give a more complete view of the customer journey. When a user views display ads on the GDN, or video ads on YouTube, and later visits your website and converts, these interactions with your brand can now be captured in Google Analytics Multi-Channel Funnels reporting.

    GDN Impression Reporting is now available through limited whitelist. You can sign-up through this form to participate. Please note that we cannot guarantee access, but we will do our best to provide this feature to as many users as possible. Please also note that this data will only surface in the Multi-channel Funnels reports in Google Analytics. For more information on how to enable the feature in GA please see our help center article.

    Read on below for more tips on how to make the most of this new feature.

    How does Display fit on the conversion path?
    By enabling GDN Impression Reporting in Google Analytics, you can learn how your display impressions assist your conversions.


    In the Multi-Channel Funnels Overview Report you will see two additional conversion metrics. Impression Assisted Conversions shows how many of your conversion paths were touched by a display impression. Rich Media Assisted Conversions shows how many of your conversions had a rich media interaction on the path to conversion. Rich media interactions are user interaction with YouTube or rich media ad formats, such as ad expansion, video control (such as play, pause, and resume), or switching a video ad to full screen.

    With the new Interaction Type selector you can now immediately filter your reports based how your users interacted with your marketing.

    • Select Impression to see conversion paths from customers who saw your GDN display ads but did not click on them.
    • Add Direct to the mix, to see who saw an ad and then visited your site directly to convert on a relevant transaction or Goal.
    • If you want to focus on Rich Media interactions, you can select this interaction type to see how your users convert after interacting with your rich media and YouTube ads.

    How do I quantify the impact of display on the conversion path?
    In the Multi-Channel Funnels Top Conversion Path report you can see two new path elements, which indicate the presence of a display interaction. The “eye” symbol indicates a pure display impression from a non-interactive display image. This means a user has been exposed to your display ad on the journey to conversion, without clicking on it. The “movie” symbol indicates a user has interacted with one of your Rich Media ads, such as a YouTube video ad.

    Now you can see how many conversion paths, and how much associated value, has been driven through paths which benefited from a display impression or rich media interactions. To better quantify your brand targeted display efforts, consider breaking out these campaigns using custom channel grouping.


    Assigning partial credit to valuable display interaction touchpoints
    You can use the custom model builder from the Attribution Modeling tool to assign partial credit to these display events. Consider giving these events on the user’s conversion path more credit, and compare this against your baseline model.

    We also added a new set of dimensions to help you define valuable custom segments for your analysis. Want to see how many users are watching your TrueView video ads fully? Just create a custom segment using one of our new dimensions, TrueView. The full list of new dimensions is:
    • Above the Fold: This dimension uses the Google Above the Fold measurement solution. The value is “Yes” if the ad was in the visible area of the screen when the page was loaded.
    • Video Played Percent: The value can be “>=25%”, “>=50%”, “>=75%”, and “100%”, allowing you to see how much of a video ad was watched.
    • TrueView: If a user has watched more than 30 seconds of an ad, or watched the ad completely, this will have a value of “Yes.” This is a payable event.
    Enabling GDN Impression Reporting in Google Analytics
    Once we have whitelisted your account, please ensure you have successfully linked your AdWords account to your Google Analytics account. Linking accounts takes just a few moments. Under ‘Data Sources’ > ‘AdWords’ you can then see an entry for each linked AdWords account. In the row there is a toggle switch named ‘GDN Impression Reports’, which turns the display impression data from the Google Display Network On and Off. Data is recorded from the time the switch is turned On.


    We hope these new tools will help you understand the full impact of your display campaigns through Multi-Channel Funnels and Attribution. Sign up today for GDN Impression Reporting in Google Analytics.

    Webinar Next Tuesday 6/18: Unleashing the Combined Power of Google Analytics and AdWords

    Register for next week’s webinar: Register here

    In many ways, Google Analytics and AdWords were made for each other. AdWords helps advertisers reach an audience and reports on advertising performance, and Google Analytics can tell you what actions your users take when they actually get to your site. You may have a high clickthrough rate (CTR) in AdWords, but what if you could see that 70% of those users left immediately after arriving on your landing page? While understanding the conversion rate of AdWords ads is critical, it’s also important to understand what happened to the users that did not convert or complete the action you wanted them to. For example, did users ‘bounce’ after landing on your site or did they view a few other pages and then leave? How much time did they spend on your site? Which keywords drive the majority of your Ecommerce revenue?

    Thanks to built-in Google product integrations that provide unique insights into your data, you can view reporting and data in Google Analytics that directly relates back to your advertising in AdWords. Understanding how to use both of them together will help you refine your AdWords campaigns and improve the performance of your business.


    Next Tuesday, join Rachel Witalec and Simon Rosen, Global Sales Strategy Leads, for a detailed look at how to use Google Analytics and AdWords together. In this webinar, we'll show you why it's important to link your Google Analytics and AdWords accounts, how to see both Google Analytics data in AdWords and AdWords data in Google Analytics, and walk through a live demo of the reports and how to use them. You'll learn how to make your marketing more effective by analyzing Google Analytics data, such as bounce rate, pages per visit, conversion rate, and Ecommerce revenue in conjunction with AdWords factors, such as keyword performance, ad copy, ad groups, and more. The webinar will also include a live Q&A section.

    Date: Tuesday, June 18, 2013
    Time: 10am PDT / 1pm EDT/ 6pm GMT
    Duration: 1 hr
    Level: 101 / Beginner
    Register: Register here

    Making it easier to measure your Goals

    Just as physical stores need to keep track of their sales and in-store visits, businesses with an online presence need to understand how visitors are interacting with their site. Google Analytics provides tools to help understand and evaluate these interactions. For example, if purchases are your key objective, Ecommerce tracking allows you to measure sales performance. Yet sales are just one possible goal—there are many other important interactions that may be valuable to your business, such as media plays, social connections, newsletter sign-ups, a minimum purchase value, or the amount of time spent on a screen. Using Goals, you can measure these types of engagement activities and track how these interactions help you to meet your larger business objectives.

    Today, we’re announcing several updates to Goals in Google Analytics—including a new set-up flow, new templates, and new verification capabilities—to make it easier for you to measure customer behavior and evaluate your performance. These updates are now live in Google Analytics.*

    How to get started with Goals
    Goals are set at the profile level. To find a profile in your Google Analytics account, click the Admin tab, then navigate to the account, property, and profile you want. Click Goals, then Create a Goal. Follow the flow to set up and start measuring your Goals. For guidance as you set up Goals, visit our help center.


    Introducing templates: An easier way to set up Goals
    We’ve redesigned and added new templates to the Goals set-up flow so you can add meaningful and actionable Goals to your Analytics account quickly.

    When you use a template, the Goal setup flow is prefilled with suggested values (based on your industry) that you can either keep or change as you walk through the process. The templates are organized into four business objectives (Revenue, Acquisition, Inquiry, Engagement) to help you think about the purpose of each Goal, plus you can still create custom goals. Note that “revenue” goals don’t necessarily imply a direct sale -- these goals are user activities which have a strong impact on your desired business outcomes. Depending on your business model, a Revenue Goal could be a purchase, such as a completed checkout; or it could also be a successful lead submission, such as a scheduled appointment. Some Revenue Goals might lend themselves to Ecommerce tracking as well.


    The templates you see are based on the Industry Category selected in your property settings, so you only see templates that are relevant to your business. We also added a set of 20 new industry categories to Google Analytics. This classification is now aligned with Google’s web standard for industry vertical classification. Please edit your property settings to make sure you’re using the one that best describes your business.

    Verify each Goal before you save
    In addition to the templates, we’ve added a way for you to check your setup before you save. You’ll find a verify option at the end of the setup flow that lets you see what the conversion rate would have been for the past seven days had this Goal been setup. Using the verify option gives you immediate feedback, so you can decide to save or modify the Goal configuration you’re working on.


    Analyze how different Goals perform and relate to each other
    Use the Goals Overview report under the Conversions section to see how your goal completions happen over time. Develop a sense how often a Goal conversion happens, and look to identify relationships between different Goals.

    In the Goals Overview report you can use the metric selector to choose the relevant metric.


    Example: Goal performance over time
    Select a single Goal and observe the performance over time. Use the date range selector and compare the Goal performance month on month, or quarter on quarter. This way you can compare seasonal trends, and the growth rate of your goal over time.


    Example: Discover relationships between goals
    Selecting two Goal completion metrics next to each other will allow you to see correlational effects over time. A Goal measuring site engagement, like a media interaction, or a social share, could be indicative of a rise in sales.

    Ultimately, understanding how your users interact with your site allows you to make important decisions about site content and effective use of your marketing and advertising resources. In addition to the Goals overview report, you can look at the reports in Multi-Channel Funnels. These reports focus on your visitors’ entire path to conversion — including the different off-site interactions they had before making a purchase or completing a goal. See if you can discover new insights and additional opportunity through Goals.


    Introducing “The Customer Journey to Online Purchase" — interactive insights on multi-channel marketing

    Savvy marketers understand that you don’t always seal the deal with a single message, image, or advertisement. A user may see a display ad, click on a link from a friend, or do a search before buying something from your website — and all of these interactions can play a role in the final sale. It’s important to understand the entire customer journey so you can measure all of the elements that contribute to your campaigns, attribute the right value to them, and adjust your marketing budgets where appropriate.

    That’s the philosophy behind Google Analytics tools like Multi-Channel Funnels and Attribution Modeling. Tens of thousands of our largest advertisers are gaining valuable insights from Multi-Channel Funnels every month, and we’ve collected these insights using aggregate statistics to develop a benchmarking tool — The Customer Journey to Online Purchase. This interactive tool lets you explore typical online buying behavior and see how different marketing interactions affect business success.


    The tool draws on Ecommerce and Multi-Channel Funnels data from over 36,000 Google Analytics clients that authorized sharing, including millions of purchases across 11 industries in 7 countries. Purchase paths in this tool are each based on interactions with a single ecommerce advertiser.

    You’ll find benchmark data for:
    • how different marketing channels (such as display, search, email, and your own website) help move users towards purchases. For example, some marketing channels play an “assist” role during the earlier stages of the marketing funnel, whereas some play a “last interaction” role just before a sale.
    • how long it takes for customers to make a purchase online (from the first time they interact with your marketing to the moment they actually buy something), and how the length of this journey affects average order values.

    Channel Roles in the Customer Journey
    The data shows that every industry is different — the path to purchase for hotel rooms in Japan is not necessarily the same as the path as for an online supermarket in Canada.

    A few findings stand out, in particular:
    • As you might expect, customers typically click on display ads early in their purchase journeys, but in some industries, such as US travel and auto, display clicks tend to occur closer to the purchase decision.
    • Across industries and countries, paid search has a fairly even assist-to-last interaction ratio, implying that this channel can act both in the earlier and later stages of the customer journey.

    Advanced tip:
    • Once you’ve explored the benchmarks, look deeper into your own marketing data with the Multi-Channel Funnel reports, and consider defining your channels and campaigns to separate out categories that are specific to your business needs.

    Purchase values and the length of the journey
    We also see interesting patterns emerge when examining the length of the customer journey. While the majority of purchases take place within a single day or a single step (i.e., a single interaction with one marketing channel), longer paths tend to correlate with higher average order values. 

    For example,
    • in US Tech, online purchases that take more than 28 days are worth about 3.5 times more than purchases that occur immediately. And while 61% of tech purchases take place on that first day, only 53% of revenue comes from single-day purchases.
    • in Consumer Packaged Goods (CPG), on the other hand, most purchases (82%) are quick, likely because these are smaller and simpler purchases that don’t require much research.
    • in Edu / Gov, 41% of revenue comes from multi-day purchases, but 60% of revenue comes from multi-step purchases — suggesting that even when customers make decisions in a relatively short time period, they often have multiple marketing interactions before purchasing.

    Advanced tip:
    • In Multi-Channel Funnels or the Attribution Modeling Tool, you can adjust the lookback window to reflect the typical length of the purchase path in your industry. For example, if your business tends to have shorter paths, you can zoom in on paths that take 5 days or less:

    Putting the benchmarks to work
    For marketers, it’s always a crucial challenge to design campaigns that deliver the right message at the right moment in a customer’s journey to purchase. We hope these benchmarks will provide useful insights about the journey and help you put your business into context. In particular, take a look at the final infographic, the “Benchmarks Dashboard,” to get a quick overview of your industry. Then, when you view your own data in the Multi-Channel Funnels reports in Google Analytics, you’ll gain a better understanding of where different channels impact your conversions and what your typical path looks like, so you can adjust your budgeting and marketing programs accordingly.

    Try The Customer Journey to Online Purchase today on Google’s new Think Insights website.

    Happy analyzing!

    Multi-Channel Funnels: Webinar, Checklist, Tips & Tricks

    This summary is not available. Please click here to view the post.

    How WBC Used Advanced Segments To Boost E-commerce Conversion Rate By More Than 12%

    Established in 1989, WBC is the UK’s largest supplier of hamper, deli and drinks packaging to independent retailers. As the website is the company’s main business generation tool, it is essential that it promote their range of 850 products in the most attractive and accessible way possible. 

    With a view to redesigning their e-commerce site and increasing the number of sales it generates, WBC was keen to understand how web traffic interacted with the site, and where potential improvements could be made.


    Following an audit of their implementation, WBC’s search engine marketing agency, Periscopix, began tracking micro-conversions such as brochure downloads and crucial interaction data like on-site search tracking. Using advanced segmentation, they found that a high conversion rate for loyal customers was hiding a very low conversion rate for users completely new to WBC.

    Aesthetically, the changes Periscopix proposed were subtle and focussed on two main areas: showcasing the range of products stocked by WBC and imposing a sense of authority in the marketplace. Using Google Analytics, Periscopix identified WBC’s most popular products. These were given prominence in the center of the homepage. The previously under-utilised right-hand side was optimised to feature media that previously had been hidden deeper in the site.

    Periscopix ran an A/B test on the homepage for three months. This resulted in a 2.2% increase in homepage engagement and a boost to the e-commerce conversion rate by 12.2%. WBC have now committed to redesigning the website, with the homepage variation proposed by Periscopix forming the cornerstone of this new structure. 

    Read the entire WBC case study and see additional success stories in our analytics case studies and success stories section.

    Posted by the Google Analytics Team

    Better results, (still) early adoption: Marketing attribution in a complex digital landscape

    Today, we’re sharing some research on marketing attribution that we conducted in partnership with Econsultancy, a leading digital market research firm. The insights -- Marketing Attribution: Valuing the Customer Journey -- provide a snapshot of how marketers and agencies are conducting attribution, the impact it has, and the barriers holding them back.

    If you’re not familiar with digital attribution, it’s about distributing credit to all of the elements of your digital marketing program, so you can gauge the impact of customer marketing interactions on your sales results and make more accurate investment decisions. Here are a few snippets from the report that we found interesting:

    It’s still a new craft, but early results show positive impact
    Although digital attribution is still relatively new -- 83% of practitioners we surveyed have been using it for less than 2 years -- it clearly has a positive impact on businesses that employ it. 72% agree that it leads to better budget allocations, 63% gained a better understanding of how digital channels work together, and 58% had clearer insights into their audience: 

    Attribution leads to improved ROI, better budgeting


    Last click attribution dominates; agencies are leading the way in experimentation
    Most digital marketers run multiple campaigns, each with different strategies and objectives. For instance, display campaigns that are designed to generate awareness will have a different impact on sales than paid search campaigns designed to bring in buyers. Yet most marketers today still use attribution models that do not account for these differences in strategy. Although only 14% of respondents consider “last click” attribution to be “very effective,” it remains common; most likely because marketers haven't yet found or mastered the right attribution tools. Digital marketing agencies have done more with sophisticated attribution methods and technologies:


    Robust attribution leads to confident digital decisions
    For organizations that use attribution, it often leads to greater confidence in marketing choices: if you know the impact of your programs, it’s easier to budget for them. As one online retailer commented, “Attribution was the missing piece to our campaign analysis. Now we don’t run a campaign without learning something about how our marketing affects the buying cycle, and then testing to see whether it applies in the long run.”

    Performing marketing attribution with Google
    Here at Google we spend our time building intuitive tools to make measurement easier, so that you can really use your data to make smarter decisions. That’s why we provide several important tools for marketing attribution, including Search Funnels in AdWords and Multi-Channel Funnels in Google Analytics. And check out our Attribution Modeling tool in Google Analytics Premium, which includes five standard attribution models plus a custom model builder, so you can create and customize attribution models in minutes, and see data instantly. Learn more in our Attribution Playbook.

    Join us for an Attribution Hangout
    If you’re available this Friday, April 6, at 9:00am PDT, please join Bill Kee, Product Manager for Attribution, and Justin Cutroni, Analytics Advocate, for a Google+ Hangout. Bill will talk about the research and give a demo of the Attribution tool in Google Analytics Premium, as well as discussing Multi-Channel Funnels and AdWords Search Funnels, two complementary features.

    To watch the Hangout on Air, tune into Justin’s Google+ Page on Friday. If you have a question that you would like us to discuss, please enter it in this this form -- and we’ll invite five of you to join the Hangout live to ask your questions.

    We look forward to seeing you at the Hangout on Friday!

    Sara Jablon Moked, Product Marketing Manager, Conversion and Attribution