
Chart Multiple Ranges
In charts, you are now able to graph multiple ranges. Take this chart depicting time vs distanced traveled.
 You can now add extra ranges by clicking on “Select ranges...” and “add another range.” You can also manually add new ranges separated by commas like “Charts!B5:B12, Charts!D5:D12, Charts!F5:F12.”
 In this example, here is what the chart with the above data selected looks like.
Hidden Sheets
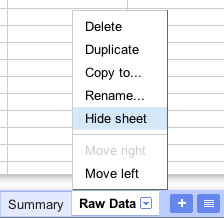
We’re also introducing the ability to hide your sheets. You can click on a sheet tab and select “hide sheet” to remove a sheet from view.
 The sheet can still be seen in the list of sheets and any editor can click on this sheet to bring this back to view. Sheets can also be accessed from the Hidden sheets option in the View menu. Learn more about sheet hiding here.


0 comments:
Post a Comment