New AdSense Data in the Core Reporting API

Google AdSense is a free, simple way for website publishers to earn money by displaying targeted Google ads on their websites. Today, we’ve added the ability to access AdSense data from the Google Analytics Core Reporting API. The AdSense and Analytics integration allows publishers to gain richer data and insights, leading to better optimized ad space and a higher return on investment.

In the past, accessing AdSense data using the Analytics Core Reporting API has been a top feature request. We’ve now added 8 new AdSense metrics to the Analytics Core Reporting API, enabling publishers to streamline their analysis.

Answering Business Questions
You can now answer the following business questions using these API queries:

Which pages on your site contribute most to your AdSense revenue?


dimensions=ga:pagePath
&metrics=ga:adsenseCTR,ga:adsenseRevenue,ga:adsenseECPM &sort=-ga:adsenseRevenue

Which pages generate a high number of pageviews but aren't monetizing as well as other pages?
dimensions=ga:pagePath
&metrics=ga:pageviews,ga:adsenseCTR
&sort=-ga:pageviews

Which traffic sources contribute to your revenue?
dimensions=ga:sourceMedium
&metrics=ga:adsenseCTR,ga:adsenseRevenue,ga:adsenseECPM
&sort=-ga:adsenseRevenue

Reporting Automation
By accessing this data through the API, you can now automate reporting and spend more time doing analysis. You can also use the API to integrate data from multiple sites into a single dashboard, build corporate dashboards to share across the team, and use the API to integrate data into CRM tools that display AdSense Ads.

Getting Started
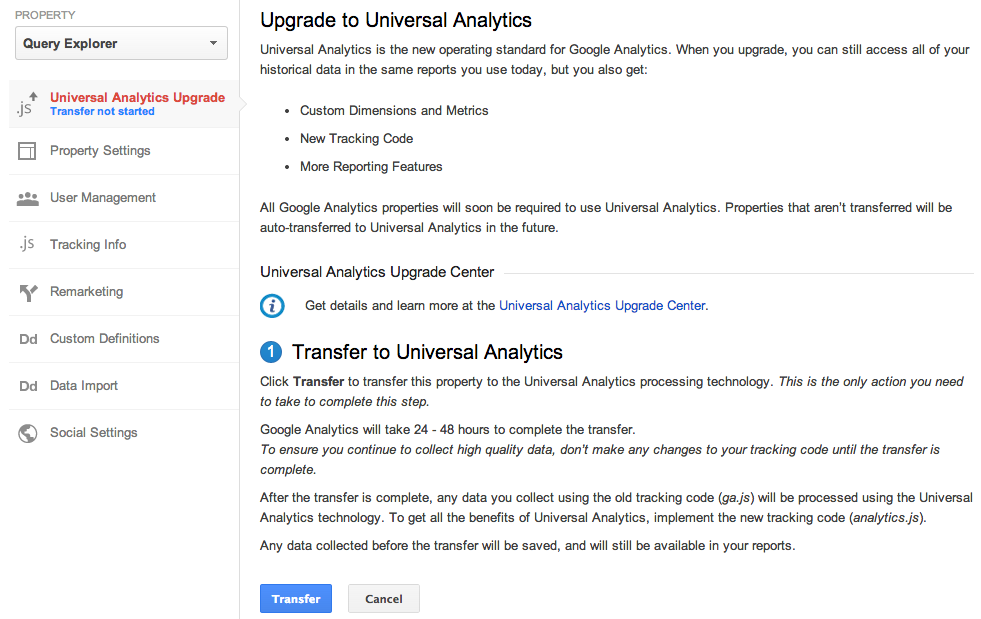
To learn more about the new AdSense data, take a look at our Google Analytics Dimensions and Metrics Explorer. You can also test the API with your data by building queries in the Google Analytics Query Explorer.

Busy? In that case, now’s a great time to try these Analytics API productivity tools:
  • Magic Script: A Google Spreadsheets script to automate importing Analytics data into Spreadsheets, allowing for easy data manipulation. No coding required!
  • Google Analytics superProxy: An App Engine application that reduces all the complexity of authorization.

We hope this new data will be useful, and we're looking forward to seeing what new reports developers build.

Posted by Nick Mihailovksi, Product Manager, Google Analytics API Team

An Easy Way to Upgrade to Universal Analytics

Last year we launched Universal Analytics, a new technology that allows you to measure customer interactions across platforms and devices. As we announced at the 2013 Google Analytics Summit, we’ve been working on a solution to help you upgrade your existing properties to the new infrastructure without losing any historical data.

Today, we’re announcing the Universal Analytics Upgrade Center, an easy, two-step process to upgrade your existing properties from classic Google Analytics to Universal Analytics.

Once you complete the upgrade process, you can continue to access all of your historical data, plus get all the benefits of Universal Analytics including custom dimensions and metrics, a simplified version of the tracking code, and better cross-domain and cross-device tracking support.

Getting Started

You can upgrade your classic Google Analytics properties into Universal Analytics properties by following these two steps:

Step 1: Transfer your property from Classic to Universal Analytics.
We’ve developed a new tool to transfer your properties to Universal Analytics that we will be slowly enabling in the admin section of all accounts. In the coming weeks, look for it in your property settings.


Step 2: Re-tag with a version of the Universal Analytics tracking code.
After completing Step 1, you’ll be able to upgrade your tracking code, too. Use the analytics.js JavaScript library on your websites, and Android or iOS SDK v2.x or higher for your mobile apps.

Universal Analytics Auto-Transfer

Our goal is to enable Universal Analytics for all Google Analytics properties. Soon all Google Analytics updates and new features will be built on top of the Universal Analytics infrastructure. To make sure all properties upgrade, Classic Analytics properties that don’t initiate a transfer will be auto-transferred to Universal Analytics in the coming months.

Upgrade Resources

To answer common questions, we’ve put together the Universal Analytics Upgrade Center, a comprehensive guide to the entire upgrade plan. This guide includes an overview of the process, technical references for developers, and a project timeline with phases of the overall upgrade.

We’ve also included FAQs in the Upgrade Center, but if you need more information, you can also visit the new Universal Analytics Google Group to search for answers and ask more specific questions.

We’re excited to offer you this opportunity to upgrade, and hope you take advantage of the resources we’ve created to guide you through the process. Visit the Universal Analytics Upgrade Google Group to share your comments and feedback. We’d love to hear what you have to say!

Posted By Nick Mihailovski, on behalf of the Google Analytics Team

New Google Analytics APIs for Large Companies

Many large companies have unique needs, with dozens of websites and many users. In the past, configuring Google Analytics for these companies was time-consuming and required too many clicks.

We're thrilled to announce a new set of APIs that will make it even easier for large companies to manage multiple websites. These APIs will streamline the Google Analytics setup process, allowing IT teams to programmatically manage and configure Google Analytics, so teams can focus their efforts on analysis and gaining insights.

Account Setup and Configuration APIs
To simplify account setup, we’ve added new APIs to manage Properties, Profiles, and Goals. This reduces the time it takes to build new account structures, and allows you to enable new features across all your existing accounts.


Note: These APIs are currently available in closed beta. Please sign up here to request access.

User Permissions APIs
To reduce the overhead in managing user access, we’ve also added APIs to manage user permissions across all your accounts. With these APIs, you can quickly list which users have access to your accounts. You can also now write programs to sync Google Analytics users with corporate directory services such as LDAP.


The User Permissions APIs are public and can be used today.

Getting Started
To get started, you can find all the API resources on our Google Analytics APIs for Large Companies page. This launch brings new opportunities to developers, IT Teams, and Google Analytics users. Let us know what you think!

How Certain Affinity used Google’s Mobile App Analytics to improve game design


Certain Affinity, an experienced independent game developer has recently been working on their first mobile title, Age of Booty: Tactics. Age of Booty: Tactics is an asynchronous turn-based tactics game hybridized with a collectable card game. Certain Affinity wanted a solution enabling them to measure and analyze specific metrics to improve both the pre-release and post-release designs of the game. They researched a number of analytics solutions, but were frequently frustrated by the cost, size, and limited flexibility offered.


Ramping Up Reporting
Certain Affinity has used Google Analytics for website analytics since 2005, and began talking to mobile partners after becoming aware of Google Analytics’ (GA’s) application in mobile gaming. Given their existing experience, the relative cost of the platform, and the extensive feature set, Certain Affinity quickly and easily integrated GA into the game. The early inclusion of GA into the design process resulted in easy access to analytics to assist in influencing direction across design, art, and ultimately production.

UI Optimization
Google Analytics provides an intuitive way to understand engagement across multiple screens and events. By leveraging engagement flow and average screen time analytics, Certain Affinity understood when specific areas within the UI were either too complex or buried to drive the desired behavior. They identified that the storefront was overly complex and required significant streamlining to become easily accessible. Additionally,they found that a number of options within the menus were too complex and lead to users looping within the UI prior to engaging in an actual game. They also were able to reduce screens per session from 15.5 to 8, resulting in a cleaner UI as well as less back and forth in the game.

Gameplay Duration
Certain Affinity wanted to better understand the average duration of play to optimize the experience on mobile. Given that users tend to spend less time gaming on their mobile devices than in the console space, it was vital to ensure the game was consumable and enjoyable in the “bite sized” engagement window.

Certain Affinity leveraged session durations to understand the existing top-level behavior. In analyzing the data,they found that the typical session was over 25% longer in length than was ideal. They tracked events such as turn submission, undo, and return to main menu to identify any behavior that was artificially extending the average duration of play. Certain Affinity then specifically targeted optimization to the areas requiring the most work.

Custom Dimensions
By leveraging Google Analytics Custom Dimensions, Certain Affinity could measure analytics across a number of key metrics in the mobile gaming space including retention, virality, and monetization. While this data was not widely used until launch,the ability to verify collection was instrumental in ensuring a successful soft launch.“The flexibility GA provides is quite amazing. While no analytics provider will ever have everything you need out of the box, it is great to have a solution that allows us to implement our own requirements [through custom variables], so easily!” explains Certain Affinity’s Lead Server Engineer.

You can check out the full case study here.


Posted by Aditi Rajaram, Google Analytics team

Google Analytics on Google Developers Live

Ever wanted to learn more about Google Analytics APIs? Maybe even have someone talking to you about how to use them? Well, if you haven’t gotten a chance to tune in, we’re excited to present Google Analytics on Google Developers Live. Our Developer Relations team has been hard at work putting these together; we’ve done a few already, and also have some coming up that we’re excited about!

We'll be doing these a few times a month, on Thursdays at 10AM PDT (full schedule here). Each show is about a half hour.


The show will either take you “Behind the Code” or “Off the Charts.” Off the Charts is a series about getting into the deep features of Google Analytics, understanding how it works, things you can do with it and how to use the feature itself. “Behind the Code” will not only showcase new GA features and technology, but also take us behind the scenes and give you a chance to hear directly from some of the engineers, product managers, and others who work behind the scenes to design, build, and deliver these new features.


Here’s some of our favorites from the past:

Off the Charts: Google Analytics superProxy


Google Analytics superProxy is an open source project developed by the Google Analytics Developer Relations team. Join Developer Advocate Pete Frisella to learn how to use this application to publicly share your Google Analytics reporting data and power your own custom dashboards and widgets.

Behind the Code: Analytics Mobile SDK


The new Google Analytics Mobile SDK empowers Android and iOS developers to effectively collect user engagement data from their applications to measure active user counts, user geography, new feature adoption and many other useful metrics. Join Analytics Developer Program Engineer Andrew Wales and Analytics Software Engineer Jim Cotugno for an unprecedented look behind the code at the goals, design, and architecture of the new SDK to learn more about what it takes to build world-class technology.


Don’t forget to check out next week’s show (8/29, 10AM PDT) on the recently launched Metadata API, which contains all the dimensions and metrics that you can query with in Google Analytics Reporting APIs. We’ll be discussing how you can use this API to to simplify data discovery. Tune in here!


Posted by Aditi Rajaram, Google Analytics Developer Relations team

Introducing The New Google Analytics Metadata API

Google Analytics users can use the Core Reporting API to save time by building dashboards and automating complex reporting tasks. This API exposes over 250 data points (dimensions and metrics), and new data is added every few months. For many developers, it can be difficult to keep their applications up to date with all the latest data.

To make things easier, today we are launching the new Google Analytics Metadata API to simplify data discovery. The Metadata API contains all the queryable dimensions and metrics included in the Core Reporting API. We’ve also added attributes for each dimension and metric, such as the web or app name, full text description, grouping, metric calculations, deprecation status, and whether the data is queryable in segments. You can check out at a live Metadata API response here.

You now have programmatic access to generate the same list of dimensions and metrics we use to generate our public documentation.


You can now create this list using the Metadata API.

Saving Developers Time

When you create tools to query the Core Reporting API, you can use the Metadata API to automatically update your user interfaces. For example, Analytics Canvas, a popular 3rd party Google Analytics data extraction tool, uses the Metadata API to keep its query building interface up to date.


Analytics Canvas uses the Metadata API to power its query builder.

According to James Standen, founder of Analytics Canvas, "In the past, keeping Analytics Canvas up to date with the Google Analytics API dimensions and metrics required a lot of manual updating to our application. The new Metadata API automates this process, saving us time, and giving our users direct access to all the great new data the instant it's available. Users love it!"

New Deprecation Policy

To increase data transparency, we’ve also published a new data deprecation policy for dimensions and metrics. New data we release will be announced on our changelogs and automatically added to the Metadata API. Data we decide to remove will be marked as deprecated in the Metadata API, allowing developers to gracefully remove these values from their tools.

Get Started Today

Our goal was to make this API super easy to use. To get started, take a look at our list of resources below:

Questions? Comments? Simply want to share in the excitement? Join the analytics developer community in our Reporting API Developer forum.


Posted by Nick Mihailovski & Srinivasan Kannan, Google Analytics API team

Introducing Google Tag Manager for Mobile Apps & New Google Analytics Services SDK

Mobile Apps pose a unique set of challenges for marketers and developers. On the web, you can iterate on content and features in near-real-time and deploy conversion tracking, Remarketing, analytics and other tags to measure the effects on your users. Apps, on the other hand, are effectively frozen at the point of user install. Making even the slightest change means waiting until your next update makes its way through the various app stores and even then, you can’t be sure that all of your users will update quickly, if at all.

The surprisingly static nature of Mobile Apps creates significant problems. Forget to add an event to a key button press? Tough! Need to add conversion tracking for a last minute campaign? Too bad! Realize you need to change an important configuration setting? Sorry, not possible... that is, until now! Previewed at Google I/O earlier this year, today we're launching Google Tag Manager for Mobile Apps.


With Google Tag Manager for Mobile Apps, you instrument your app once and from then on, you can change configurations and add analytics, remarketing and conversion tracking later – without updating your app. 

Just like on the web, Google Tag Manager continues to be a free product, streamlining the process of adding “tags” to your native iOS and Android apps, making it both easy and accountable. Measuring key events is now as simple as 1-2-3:
  1. Include the new Google Analytics Services SDK (Android, iOS) in your app. This new unified SDK includes both Google Tag Manager and Google Analytics functionality while sharing a common framework.
  2. Push interesting and important events to the Data Layer. Once events are registered on the data layer, they can be used to trigger Google Tag Manager Tags and Macros. 
  3. Use Google Tag Manager’s web-based interface to write Rules and determine when various Tags should fire.

If you’re already a Google Tag Manager user, then there’s really nothing new for you to learn. The same style Tag Templates, Rules and Macros that you already know are now available for the new Mobile App Container Type. New users can get up to speed quickly, thanks to the easy-to-use web-based interface.  

Google Tag Manager for Mobile Apps natively supports AdWords Conversion Tracking, AdWords Remarketing and Google Analytics for Mobile Apps (Universal Analytics) tags. It also supports custom and 3rd party tracking events using the custom tag. For Mobile Apps, Google Tag Manager also takes things one step further using the Value Collection Macro. As we previewed at I/O 2013, developers can now create server-side configurations and use them to build highly configurable Apps. Collectively, these new features make Google Tag Manager a powerful tool for marketers and App Developers alike.  

Sign-up for your free Google Tag Manager account now and learn more about Mobile App tagging.  

Posted by Russell Ketchum, Product Manager, Google Analytics & Google Tag Manager

Easily A/B Test Your Website's Call-to-Action Using Content Experiments API

You may have seen our news about the launch of the Content Experiments API a few months ago, and we’re excited to share one of the ways it’s been used since the launch. SiteApps created an experiment to A/B test your website’s call to action using our Content Experiments API -- take a look at their post below to see how they did it!

Live A/B testing is arguably the most scientific strategy you can use for conversion rate optimization. Nothing better than identifying what really sells more than your actual users in the real environment. And probably the call-to-action (CTA) button – “Sign-Up“, “Buy Now” or “Learn More” – is one of the most important elements to test. Some websites earned millions with a simple button change:


There’s an app for that

We created the Button Optimizer app on SiteApps to allow any website to instantly test & optimize their call-to-action without any technical knowledge (and for free!). With three simple steps, you can increase your website’s conversion right now:
  1. Install SiteApps on your website (it’s free)
  2. Create a Content Experiment in Google Analytics
  3. Add the Button Optimizer app
Then you can see this sexy report in Google Analytics and see how a small change can really impact your bottom line:


Eating our own dog food

Take a look at this video on testing the siteapps.com homepage button in under 3 minutes:

This post was cross-posted from the SiteApps blog. For step-by-step instructions, click here.

40 New Data Points In Google Analytics API

Over the past year we’ve added many new features to Google Analytics. Today we are releasing all of this data in the Core Reporting API!


Custom Dimensions and Metrics

We're most excited about the ability to query for custom dimensions and metrics using the API.

Developers can use custom dimensions to send unique IDs into Google Analytics, and then use the core reporting API to retrieve these IDs along with other Google Analytics data.

For example, your content management system can pass a content ID as a custom dimension using the Google Analytics tracking code. Developers can then use the API to get a list of the most popular content by ID and display the list of most popular content on their website.

Mobile Dimensions and Metrics

We've added more mobile dimensions and metrics, including those found in the Mobile App Analytics reports:

  • ga:appId
  • ga:appVersion
  • ga:appName
  • ga:appInstallerId
  • ga:landingScreenName
  • ga:screenDepth
  • ga:screenName
  • ga:exitScreenName
  • ga:timeOnScreen
  • ga:avgScreenviewDuration
  • ga:deviceCategory
  • ga:isTablet
  • ga:mobileDeviceMarketingName
  • ga:exceptionDescription
  • ga:exceptionsPerScreenview
  • ga:fatalExceptionsPerScreenview

Some examples of questions this new data can answer are:

Local Currency Metrics

If you are sending Google Analytics multiple currencies, you now have the ability to access the local currency of the transactions with this new data:

  • ga:currencyCode
  • ga:localItemRevenue
  • ga:localTransactionRevenue
  • ga:localTransactionShipping
  • ga:localTransactionTax

Time Dimensions

We also added new time based dimensions to simplify working with reporting data:

  • ga:dayOfWeekName
  • ga:dateHour
  • ga:isoWeek
  • ga:yearMonth
  • ga:yearWeek

Sample queries:

Traffic Source Dimensions

Finally, we've added two new traffic source dimensions, including one to return the full URL of the referral.

  • ga:fullReferrer
  • ga:sourceMedium

Sample query: the top 10 referrers based on visits (using full referrer).

For a complete list of the new data, take a look at the Core Reporting API changelog.
For all the data definitions, check the Core Reporting API Dimensions and Metrics explorer.
As always, you can check out this new data directly within our Query Explorer tool.
We’re very excited to release this data and thrilled to see what developers build next!

Posted by Srinivasan Kannan & Pete Frisella, Google Analytics API Team

Google Analytics at Google I/O recap


It was a busy week in San Francisco at Google I/O. We unveiled new products and features, such as deeper mobile app analytics integration with Google Play and Google Tag Manager for mobile apps. If you missed the earlier announcement, you can learn about our new features here.


Our team at Google I/O!


We also gave several great presentations on some of our new features. Our Developer Relations team also showed off some tools for multi-screen measurement here, so take a look if you didn’t manage to catch our livestream this past Thursday.

We also presented on dynamically configuring mobile applications using Google Tag Manager for mobile apps, and talked about Google Analytics and AdSense data analysis in BigQuery.

It was great to see so many GA users and developers-- we can’t wait to see everyone next year at I/O!


Google Analytics at Google I/O

We’ve been working hard getting ready for Google I/O! We're livestreaming our presentation on how to optimize web and mobile apps across devices using Google Analytics on Thursday, May 16 at 1:40pm PT and we’d like to invite everyone to join us.

We recently launched Universal Analytics, a new way to measure user interactions across any device / platform / environment. By measuring this data, developers can better optimize their applications. In this session we'll discuss how to measure user-interaction from any device as well as demo new reports and best practices to optimize both web and mobile apps.

For those of you who are going to be at I/O, please stop by the Ads sandbox and say hi to the Analytics team! We’ll be around to answer questions, and we may even have some pretty cool Analytics gear to give out. Be sure to check out all of our Analytics sessions. You can find the full schedule here.


Is the web getting faster?

At Google, we are passionate about speed and making the web faster. A faster web is better for both users and businesses - faster pages lead to better user experience and improved conversions.

The Site Speed reports in Google Analytics give every website owner detailed data on the speed of their web pages, as experienced by real users.

Last year, we published a study on the speed of websites around the world based on one week of aggregated Site Speed data from opted-in web publishers.

Over the last year, we have seen significant improvements in the core infrastructure that powers the Internet: the web browsers have gotten faster; there have been quite a few LTE/4G deployments making mobile networks a lot faster; and processing power on mobile devices continues to increase at a rapid pace.

To determine whether these improvements in technology are making the web faster, we present recent Site Speed data and compare it with the data from last year.

Here are the results.


While access from desktop is only a bit faster, it is still impressive given that the size of the web pages have increased by over 56% during this period. It’s great to see access from mobile is around 30% faster compared to last year. This is evident from the histograms below as well. For desktop, there is not a significant change in the bucket distributions, but for mobile we see a shift from slower buckets (i.e. higher page load time) to faster buckets.


Taking a look at change in the speed of web pages for a few specific countries, for most of them, there is a slight improvement in page load times on the desktop.


However, there is a significant improvement in page load times on mobile.


The following interactive world map compares the relative improvement in median page load times for desktop over the last year.


This map shows the same data for mobile (Countries without enough data for accurate measurement either this year or last year are shown as having 0% improvement). Speed improvements are greater for mobile in most of the world.


If you are a web site owner, you can analyze and speed up your web site using the PageSpeed products, and check the resulting improvements in Site Speed reports.


Optimize Your Website with SiteApps and GA

Google Analytics excels at collecting an incredible amount of information about how visitors interact with the web and mobile properties of its users. This data provides marketers and analysts who know what they’re looking for with with an incredibly powerful platform to understand what’s working and what’s not. To those who aren’t sure what they’re looking for though, all of this information can be overwhelming and make it easy to take no action at all.

SiteApps enables businesses to get instantaneous, free recommendations on how to optimize their website based on their Google Analytics data. SiteApps’ technology runs hundreds of automated analyses on its customers’ web data to identify opportunities for improvement. Based on these tailored recommendations, SiteApps then enables businesses to install apps from their marketplace to help solve these problems.


One of SiteApps’ customers is a family-owned home furnishings designer that was having difficulty maintaining their eCommerce presence while still focusing on the day-to-day operations of their brick and mortar retail store.  Within minutes of signing up for SiteApps, they were able to identify dozens of opportunities for site optimization. By installing the apps that were recommended to them, they were able to create a compelling web presence that increased their conversion rate by 108% and led to 65% more time spent on site by its visitors.  This led to a substantial increase in revenue for the business simply by unlocking the power of their web analytics data.

Our business is completely based on data. It’s incredibly important to us that customers know - or learn - just how valuable their data is,” says Phillip Klien, co-founder of SiteApps. “We consider Google Analytics the foundation for our platform and use the results to help customers make the most of the data their website produces.”


SiteApps is free to try and takes a matter of minutes to set-up.  Give it a try today to see what you can uncover from your web analytics.


Posted by the Google Analytics team

Extract Insights Across Datasets with SumAll

Businesses collect and rely on data that exists in silos across the web - from site analytics to inventory numbers, social media to sales data, there’s more important data available today than most are able to aggregate and analyze themselves.

SumAll is a connected data platform that enables business operators from companies of all sizes to visualize their mission-critical data through one centralized location.  Users of SumAll can extract insights across datasets by combining and analyzing the metrics that matter most to them.  “Put simply, our vision is to democratize information by making it beautiful, affordable and accessible to all.  In doing so, the visibility and insights that SumAll brings enables business operators to turn data into dollars,” says Catherine Gluckstein, President of SumAll.


One of SumAll’s customers was having a very difficult time making sense of his eCommerce, Google Analytics and social media data.  He knew there was a story to be told about how each was influencing the other, but being a small business owner, he lacked the resources to dive too far into them himself.  He decided to give SumAll a try and within a few minutes and even fewer clicks, was able to integrate all of his key data and view it in one uniform dashboard without having to work with his developers.

For the first time, he was able to see what was happening across his business and understand the relationship between his social media posts, web traffic and transactions.  This made him more comfortable continuing to invest his limited resources in social media because, for the first time, he could see that it was working.

SumAll integrates with all major components of the eCommerce ecosystem including payment processors, social platforms, shopping carts, online marketplaces and, of course, Google Analytics.  “It only took us about 6 weeks to complete our integration with Google Analytics, from concept to go live,” according to Catherine.  “After our customer completes the authentication and authorization process, we ingest their data into SumAll and normalize it to make it available to all SumAll applications across web, mobile and email.”

SumAll is free to try and is incredibly intuitive and straightforward to set-up.  Sign-Up today to break down the silos around your data and empower your business’ data-driven decisions today.


Posted by John Milinovich

John is a Developer Program Manager working to build the ecosystem around the Google Analytics APIs. In his spare time he likes to explore San Francisco and cheer loudly during UCLA games.

Segment Your GA Data by Demographics with UserReport

One of the most complex challenges that marketers face is managing the effective segmentation of their user base. Each of their target audiences has a different set of preferences and the process of creating campaigns based on intuition just isn't effective.

UserReport is an on-site survey tool that integrates with Google Analytics and tackles this problem head-on. The product providing the ability to use demographic information and traditional research data to optimize acquisition, content and conversions when working with websites.

UserReport helps its users collect information about their website’s visitors with a free online survey tool that measures usability and key demographics of the site’s users. The product integrates harmoniously with Google Analytics to turn the survey data they collect into actionable insights by merging it with the behavioral data already stored in Google Analytics.


SAXO.com is one of the largest online book stores in Denmark and utilizes UserReport to identify their highest value demographic segments, create more targeted advertising material and to better understand which online advertising networks they should use for targeting specific groups of customers. By using UserReport, SAXO.com was able to uncover some surprising insights about their customers, including:
  • Men and women have about the same conversion rate, but the average basket size for women is almost $20 higher than it is for men. This made SAXO.com feel more comfortable in supporting a higher CPM/CPC to advertise to niche female audiences. 
  • SAXO.com’s older book buyers have a higher conversion rate than their younger counterparts but the younger buyers’ average basket size is about $40 more than the older users’. A closer investigation revealed that most of these young customers were students purchasing books for classes. This led SAXO.com to focus on targeting the university student market to bring more young buyers into the mix.
The findings made by SAXO.com through integrating their Google Analytics data with their UserReport survey data has enabled them to create online campaigns focused on bundling unique, focused products and target them at the right customers on the right channels to drive conversions.

UserReport is free to use and takes minutes to set up. Give it a try to see what you can uncover about your own online audience!


Posted by John Milinovich

John is a Developer Program Manager working to build the ecosystem around the Google Analytics APIs. In his spare time he likes to explore San Francisco and cheer loudly during UCLA games.

Analytics reporting with Google Apps Script at the UK Cabinet Office


Guest author Ashraf Chohan works at the Government Digital Service (GDS), part of the UK Cabinet Office. Originally posted on the Google Apps Developer Blog by Arun Nagarajan.

Recently, when we were preparing the launch of GOV.UK, my team was tasked with creating a series of high-level metrics reports which could be quickly compiled and presented to managers without technical or analytical backgrounds. These reports would be sent daily to ministers and senior civil servants of several government departments, with the data customised for each department.

We decided to use Adobe InDesign to manage the visual appearance of the reports. InDesign’s data-merge functionality, which can automatically import external data into the layout, made it easy to create custom departmental reports. The challenge was to automate the data collection using the Google Analytics API, then organize the data in an appropriate format for InDesign’s importer.

In a previous post on this blog, Nick Mihailovski introduced a tool which allows automation of Google Analytics Reporting using Google Apps Script. This seemed an ideal solution because the team only had basic developer knowledge, much of the data we needed was not accessible from the Google Analytics UI, and some of the data required specific formatting prior to being exported.

We started by building the core reports in a Google spreadsheet that pulls in all of the required raw data. Because we wanted to create daily reports, the start and end dates for our queries referenced a cell which defaulted to yesterday’s date [=(TODAY())-1].


These queries were dynamically fed into the Google Analytics API through Apps Script:
// All variables read from each of the “query” cells  
var optArgs = {
'dimensions': dimensions,
'sort': sort
'segment': segment
'filters': filters,
'start-index': '1',
'max-results': '250'
};

// Make a request to the API.
var results = Analytics.Data.Ga.get(
tableId
, // Table id (format ga:xxxxxx).
startDate
, // Start-date (format yyyy-MM-dd).
endDate
, // End-date (format yyyy-MM-dd).
endDate
, // Comma seperated list of metrics.
optArgs
);
Next, we created additional worksheets that referenced the raw data so that we could apply the first stage of formatting. This is where storing the data in a spreadsheet really helps, as data formatting is not really possible in the Google Analytics UI.

For example, the final report had a 47-character limit for page titles, so we restricted the cells in the spreadsheet to 44 characters and automatically truncated long URLs by appending “...”.


Once the initial formatting was complete, we used formulas to copy the data into a summary sheet specially laid out so it could be exported as a CSV file that merges seamlessly into InDesign.


Below is an example of how a report looks on publication. Nearly everything on the page was extracted from the API tool, including the department name and the day number. Because most of the data was automated, it required minimal effort on our part to assemble these reports each morning.


We discovered that an added bonus of pulling data into a Google spreadsheet was that it also allowed us to publish the data to a Google site. This helped us display data to stakeholders without adding lots of users to our Google Analytics account.


The tools let us present Google Analytics data in deeper, more creative ways. That’s really important as we share information with more and more non-technical people, whether they’re inside GDS or beyond.

Posted by John Milinovich, Google Analytics team

Ads